Uncovered Options Trading System

 The Nasdaq 100 Index (NDX) is a basket of 100 of the largest companies listed and traded on the Nasdaq National Market (which is part of the Nasdaq Stock Market). The QQQ is ETF (Exchange Traded Fund) that tracks the NASDAQ 100 Index. The NASDAQ Stock Market is based on market capitalization of the 100 of the largest domestic and international non-financial companies, including computer hardware and software, telecommunications, retail/wholesale trade and biotechnology. The NASDAQ 100 index was lunched in January 1985. The QQQ started to trade since March 10, 1999.
The options on the QQQ are available on the Chicago Board Exchange.
Since the QQQ tracks the NASDAQ 100 index, it's evident that the index technical analysis must be included into the QQQ analysis and any trading system or trading strategy designed to trade QQQ or QQQ options should be mainly based on the NASDAQ 100 technical indicators.
Trading the QQQ options is not for everyone, as fortunes are made and lost daily, but they are perfect for speculators who can fully understand and handle the immense risks.
Many traders use QQQ charts and undertake a QQQ technical analysis while completely forgetting about the NASDAQ 100 index and the fact that QQQ is not a public company. Even if the QQQ stocks (shares) could be traded as stocks of a regular public company, it would be wrong to apply the same technical analysis to QQQ as you would to a public company's shares.
QQQ stock is an Exchange-Traded Fund (ETF) that tracks the performance of the NASDAQ 100 index. The QQQ stock was developed to track the Nasdaq 100 and the QQQ price is set at approximately 1/40th of the NASDAQ 100 index price. If you check the NASDAQ 100 and QQQ prices, you will see that for as long as QQQ has existed, its price has been about 1/40th of the NASDAQ 100 price.
You can say that the price of a regular stock is driven by supply and demand. If there are more buyers than sellers and buyers are willing to pay more than the stock's bid price, the price of this stock will rise. Conversely, if the number of sellers is greater than the number of buyers, and sellers are willing to sell for less than the stock's asking price, the price of this stock will decline.
YOU CANNOT SAY THE SAME ABOUT QQQ STOCK. The QQQ price is always calculated to match 1/40th of the NASDAQ 100 index price. No matter how many QQQ sellers and buyers there are in the stock market, if the NASDAQ 100 index declines at the end of the day, the QQQ stock will also be down. It does not matter what the supply/demand balance is for the shares of this ETF - its trend moves in the index trend direction. This is the nature of Exchange Traded Funds - they are set to track benchmark indexes.
Now, a logical question is, "Why should you apply technical analysis to QQQ, completely forgetting about its benchmark index???" Index technical analysis and index charts are more suitable for ETFs trading then ETFs analysis and ETFs charts. If the technical indicators that are applied to the NASDAQ 100 index point to a trend reversal, QQQ will follow the index trend, even if the same technical indicators that are applied to QQQ point in the opposite direction.
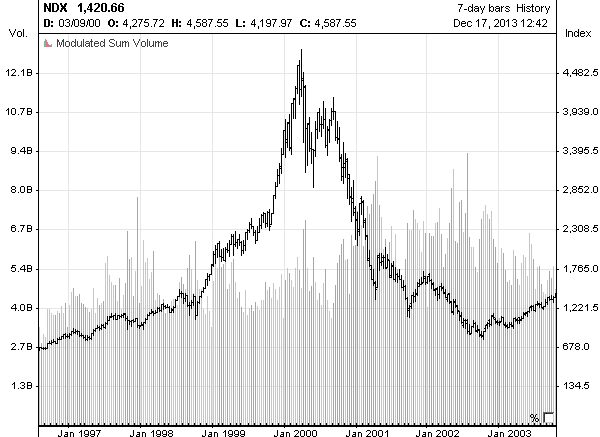
The trap in which many traders are caught is that the index and ETF prices are tied and they have the same trend and, in most cases, the price-based technical indicators that are applied to ETF and the index will generate similar signals. HOWEVER, in the case of volume-based technical indicators, you may have different signals because index volume covers volume of all stocks from this index basket, whereas ETF volume covers only one stock. This is the mistake made by many investors. When analyzing QQQ volume, they forget that the flow of the money in QQQ does not reflect the money flow in the entire NASDAQ 100 sector!!!
So, why fool yourself by looking at the QQQ chart? Why shouldn't you take a look at index charts, if the only way to analyze ETF is to use technical indicators that are applied to the benchmark index? Yes, you may use ETFs charts, but you will be limited strictly to price--based technical analysis. So, don't waste time, Start using the NASDAQ 100 charts and NASDAQ 100 technical analysis for trading QQQ stocks.
With the NASDAQ 100 chart, you may receive something that you will never get with QQQ or any other single stock. Don't limit your analysis. Start using:
Most of the analyses above cannot be done on a single stock. As you can see, the index technical analysis can deliver a much greater benefit to your QQQ trading than a simple analysis of the QQQ price. Without an index analysis, you are trading like "a blind cat in a dark room." Do not hesitate -
Naked options trading is very risky - many people lose money trading them. It is recommended contacting your broker or investment professional to find out about trading risk and margin requirements before getting involved into trading uncovered options.